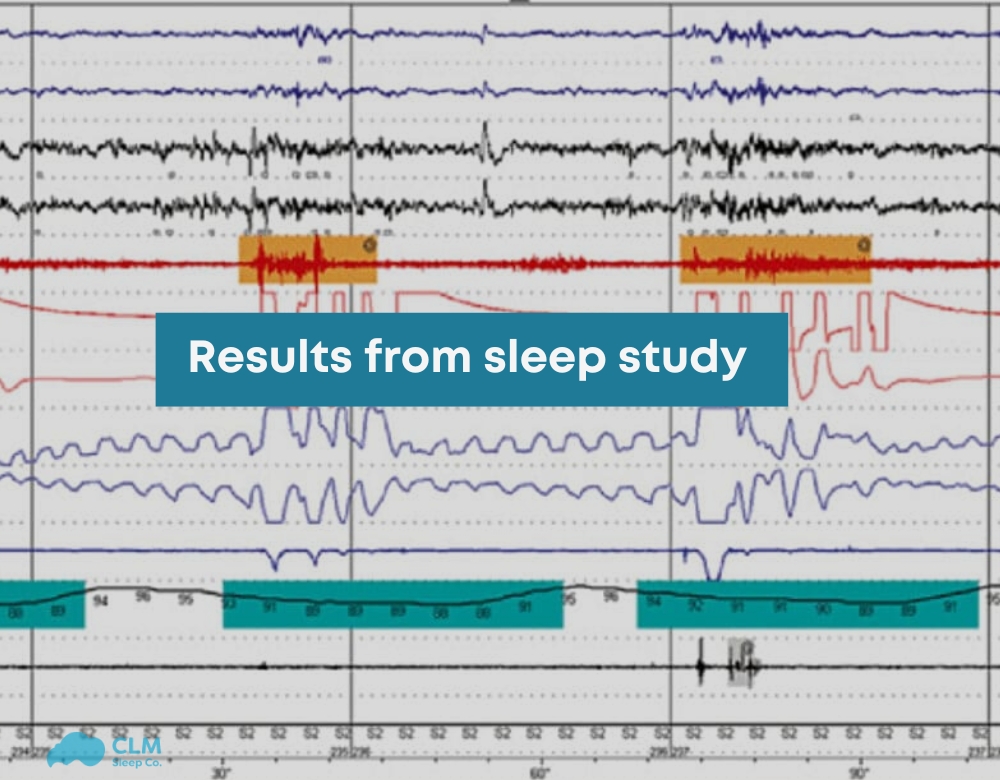
The comprehensive sleep evaluation and a multitude of sleep parameters enable the assessment of disorders that can potentially interrupt the calming effects of even slospatialized sleep. These data can provide a good indication of sleep health regarding respiratory irregularity and arousal and oxygen desaturation. Their results from sleep study can lead to target-specific models for improving the general level of well-being and quality of life within that construct. Viewers seeking full guidance on another subject, take a glance into CLM Sleep today.
What is a Sleep Study?
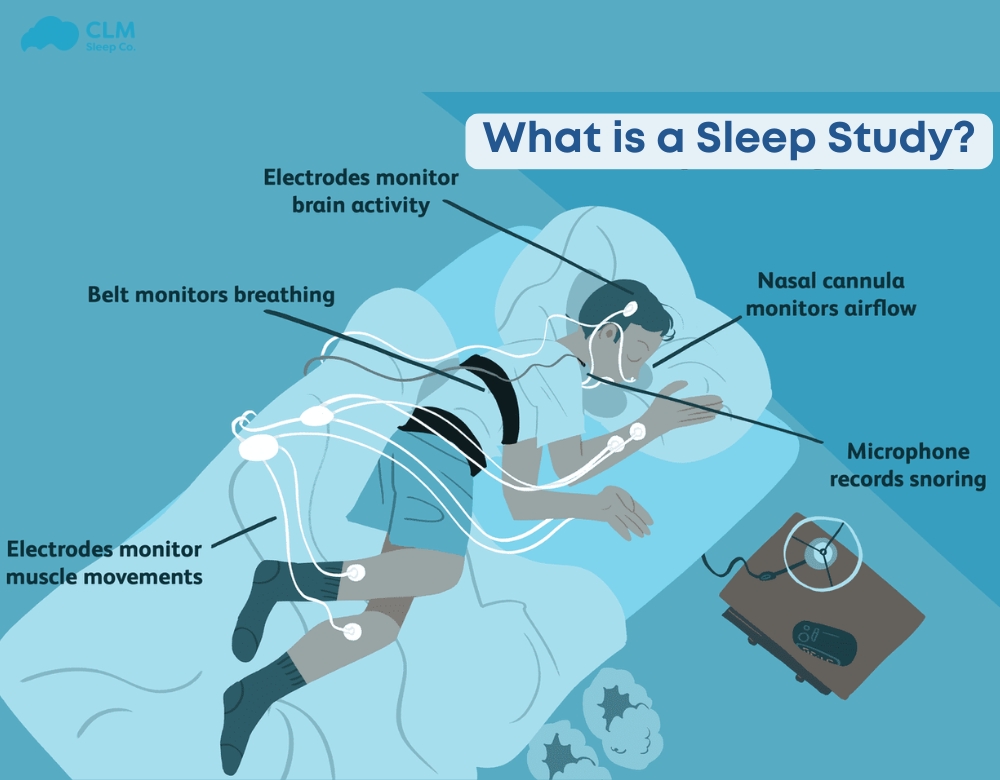
A sleep test or polysomnography interpretation is a broad-and-narrow spectrum diagnostic examination to assess sleep disorders and determine the quality of sleep a person can get during sleep. So monitoring different physiological parameters could lead to the conclusion of whether the sleep pattern is disrupted or abnormal and might thereby affect health and well-being.
Data reflect sleep study as a 1-night record of information related to brain activity, breath patterns, amount of oxygen in the blood, heart rate, and physical activity while an individual sleeps. The compiled data analyses are performed to detect specific disorders related to sleep such as sleep apnoea, restless legs syndrome, or insomnia. Sleep studies are undertaken in specialized sleep facilities or, sometimes, through home-testing kits.
See more: Levels of sleep studies
Types of Sleep Studies
In lab polysomnography (PSG): This is the standard overnight sleep study and is conducted in a clinical center. It is used to track brain waves, oxygen, heart rate, breathing, and body movement to pick up disorders such as obstructive sleep apnea and narcolepsy.
Home Sleep Apnea Test (HSAT): This test screens for sleep apnea and uses fewer channels than PSG to monitor a person in the familiarity of his own home.
Multiple Sleep Latency Test (MSLT): This assesses a person’s sleep-onset latency. It’s frequently utilized to diagnose narcolepsy.
Maintenance of Wakefulness Test (MWT): This test assesses a person’s ability to stay awake and is often used in professions where staying alert is critical, such as for pilots or drivers.
Actigraphy: A non-invasive method that uses a wrist-worn device to track sleep patterns over days or weeks. It’s particularly useful for identifying insomnia or circadian rhythm disorders.
See more: Sleep study cost
Why Undergo a Sleep Study?
Sleep studies are essential for diagnosing and managing sleep disorders that may impact overall health and quality of life. Common reasons for undergoing a sleep study include:
Identifying Sleep Disorders: Conditions like sleep apnea, insomnia, and restless leg syndrome can severely disrupt rest and cause long-term health complications.
Evaluating Treatment Efficacy: Sleep studies can measure the success of treatments like CPAP therapy for sleep apnea.
Improving Daytime Function: Diagnosing and treating sleep problems can reduce daytime fatigue, improve concentration, and enhance overall performance.
Preventing Health Risks: Untreated sleep disorders are associated with risks like heart disease, stroke, and obesity, making early diagnosis and intervention crucial.
See more: Sleep study wire-up
Terms in results from sleep study
AHI (Apnoea-Hypopnoea Index)
The AHI quantifies the total number of apnoea and hypopnoea episodes occurring per hour of sleep.
Apnoea: A complete cessation of breathing lasting at least 10 seconds.
Hypopnoea: A significant reduction in breathing lasting at least 10 seconds.
Together, these episodes disrupt sleep by triggering brief awakenings and decreasing oxygen levels. The severity of sleep apnoea is determined by the frequency of these events:
0-5 events/hour: Normal
6-15 events/hour: Mild sleep apnoea
16-29 events/hour: Moderate sleep apnoea
30+ events/hour: Severe sleep apnoea
Arousal
An arousal is a brief awakening from sleep, lasting at least 3 seconds. These can occur due to apnea or hypopnoea, prompting the person to wake momentarily to restore normal breathing. While arousals are typically too short to remember, they disrupt sleep quality and may lead to fatigue or daytime sleepiness.
Sleep Efficiency
Sleep efficiency measures the percentage of time spent sleeping relative to the total time in bed. It is calculated as:
(Total Sleep Time ÷ Total Time in Bed) × 100
Normal efficiency: 80% or higher
Example: Spending 8 hours in bed should result in at least 6.4 hours of sleep to achieve 80% efficiency.
Young, healthy adults often achieve efficiencies above 90%.
Sleep Latency
This is the time it takes to fall asleep after going to bed.
Normal latency: 5-15 minutes
Latency under 5 minutes: May indicate excessive sleepiness
Latency over 15 minutes: Could suggest difficulty initiating sleep
Sleep Architecture
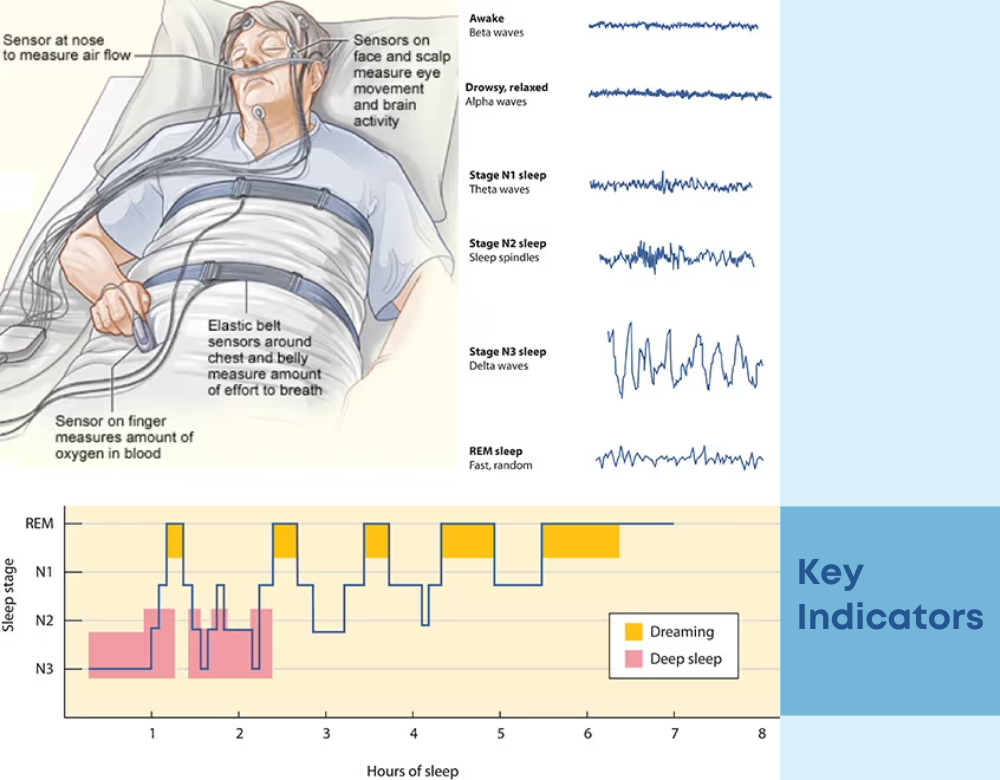
Sleep architecture describes the structure and stages of sleep within a cycle. Each sleep cycle lasts approximately 90-120 minutes, with 4-5 cycles expected per night.
Stages of Sleep
Sleep occurs in cycles made up of different stages, each with a specific role in rest and recovery. Here’s a quick look at the main stages of sleep:
Stage 1: Light sleep or “drowsiness,” where individuals may still be aware of their surroundings. Accounts for 5-10% of total sleep time.
Stage 2: A deeper sleep without awareness of surroundings, making up 25-45% of sleep.
Stage 3: Deep sleep, during which waking is more challenging. Around 20-25% of sleep occurs in this stage. Older adults may experience less deep sleep.
Stage R (REM sleep): The dreaming stage, comprising 20-30% of sleep. REM sleep increases later in the night.
REM Latency
The time it takes to enter the first REM sleep phase after initially falling asleep. Typically, this occurs 70-110 minutes after sleep onset.
Oxygen Saturation (SaO₂)
Refers to the blood’s oxygen level, with a normal range of 94-100%. Individuals with sleep apnoea or lung conditions often experience reduced oxygen saturation during sleep.
Periodic Limb Movement Index (PLMI)
Periodic Limb Movements are repetitive leg jerks during sleep, occurring every 5-20 seconds. Severe movements can disrupt sleep, causing brief awakenings. PLMI measures the frequency of these movements per hour. Excessive limb activity may require treatment with supplements or medications.
Key Indicators
AI (Arousal Index)
What it measures: The frequency of awakenings or disturbances during sleep.
Measurement method: Assessed through polysomnography (sleep study) using EEG to detect brain wave changes.
Significance: High AI values indicate fragmented sleep, which may affect overall restfulness and recovery.
How to interpret results: A normal AI is typically less than 5 events per hour in adults.
Example: An AI of 20 may suggest sleep apnea or other sleep disorders.
AHI (Apnoea Hypopnea Index)
What it measures: The number of apnoea (breathing stops) and hypopnoea (shallow breathing) events per hour of sleep.
Measurement method: Recorded during a sleep study using airflow sensors and oxygen monitors.
Significance: Key indicator of sleep apnea severity.
How to interpret results: AHI < 5: Normal; 5-15: Mild; 15-30: Moderate; >30: Severe.
Example: An AHI of 25 indicates moderate sleep apnea.
RDI (Respiratory Disturbance Index)
What it measures: The total number of respiratory-related sleep disturbances, including apnoea, hypopnoea, and respiratory effort-related arousals (RERAs).
Measurement method: Analyzed through polysomnography.
Significance: Provides a more comprehensive view of respiratory issues during sleep.
How to interpret results: Similar thresholds to AHI for diagnosing severity.
Example: An RDI of 20 suggests moderate respiratory sleep disturbances.
Oxygen Saturation Levels
What it measures: The percentage of oxygen in the blood during sleep.
Measurement method: Monitored with a pulse oximeter during sleep studies.
Significance: Low levels indicate poor oxygenation, often linked to sleep apnea or other conditions.
How to interpret results from sleep study: Normal is 95-100%; values below 90% may indicate hypoxemia.
Example: A saturation level dropping to 85% signals oxygen desaturation during apnea episodes.
Sleep Stages
What it measures: The distribution of sleep stages (REM, NREM) during the night.
Measurement method: Determined through EEG and polysomnography.
Significance: Balanced sleep stages are crucial for rest and recovery.
How to interpret results: REM sleep should make up 20-25% of total sleep.
Example: A lack of REM sleep may suggest stress or certain disorders.
Heart Rate
What it measures: Fluctuations in heart rate throughout sleep.
Measurement method: Recorded using ECG or wearable devices during sleep studies.
Significance: High variability may indicate restful sleep, while abnormalities can signal disorders.
How to interpret results: A normal sleeping heart rate is 40-60 bpm.
Example: Elevated heart rate during sleep could suggest arousal or stress.
Leg Movements
What it measures: Frequency and intensity of leg movements during sleep.
Measurement method: Tracked with electromyography (EMG) sensors.
Significance: Frequent movements may indicate restless leg syndrome (RLS) or periodic limb movement disorder (PLMD).
How to interpret results: Normal is less than 15 movements per hour.
Example: 30 leg movements per hour may disrupt sleep quality.
Cerebral Activity
What it measures: Brainwave patterns during sleep stages.
Measurement method: Monitored via EEG during polysomnography.
Significance: Helps identify sleep stages and disorders like insomnia.
How to interpret results: Consistent delta waves indicate deep sleep, while frequent beta waves suggest wakefulness.
Example: Excessive beta wave activity may reflect difficulty staying asleep.
Snoring Index
What it measures: The frequency and intensity of snoring episodes.
Measurement method: Captured through sound sensors and airflow monitors during sleep studies.
Significance: High snoring index is often linked to sleep apnea.
How to interpret results: A low snoring index (<10) is considered normal.
Example: An index of 40 indicates habitual and possibly disruptive snoring.
Cytokines and Hormones
What it measures: Levels of sleep-related cytokines (inflammatory markers) and hormones like melatonin and cortisol.
Measurement method: Blood tests or other biomarkers collected during sleep studies.
Significance: Imbalances may indicate poor sleep quality or underlying health issues.
How to interpret results: Elevated cortisol at night suggests stress, while low melatonin levels may indicate insomnia.
Example: High pro-inflammatory cytokines can correlate with sleep disturbances in chronic conditions.
The results from sleep study revealed moderate obstructive sleep apnea, fragmented sleep, and periods of oxygen desaturation. These findings highlight the need for immediate intervention, such as CPAP therapy and lifestyle changes, to restore healthy sleep patterns and prevent associated health complications. Regular follow-ups and personalized treatment plans will be essential in optimizing sleep quality and long-term health outcomes. You can visit CLM Sleep to experience diagnostic services including Home Sleep Studies, Laboratory Sleep Studies, MSLT, and Driving Simulator tests, all delivered quickly and accurately at an affordable cost.
